 The standalone monthly seasonally adjusted annual rate (SAAR) of total housing starts for all of Canada fell to 215,365 units as of last measure, down 13% from 248,296 units the previous period, according to the Canada Mortgage and Housing Corporation (CMHC).
While supply chain disruptions and persistent homebuyer affordability issues continue to hamper new home construction, rising costs are also to blame for the slowdown, with residential construction costs increasing 19.1% annually, according to Statistics Canada.
A lack of supply continues to fuel affordability challenges and constrain market activity, as elevated home prices and increased interest rates limit the number of eligible buyers and cut into purchasing power. Currently the Housing Affordability Index in the region is 54 for single family homes, these are historically low affordability rates. This index measures housing affordability by comparing median income to median home prices. For example, an index of 120 means the median household income is 120% of what is necessary to qualify for the median-priced home under prevailing interest rates. A lower number means less affordability. With the index reporting in the mid 50’s, many would-be buyers have turned to the rental market, where monthly rents continue to hit record highs due to limited supply and a surging demand.
In order to encourage development of both new homes and rental properties the government announced amendments to the Prohibition on the Purchase of Residential Property by Non-Canadians Act after it realized some unintended consequences that industry professionals voiced concern over. The amendments include repealing the existing provision so the prohibition doesn’t apply to vacant land, an exception for development purposes and an increase on the foreign corporate control threshold.
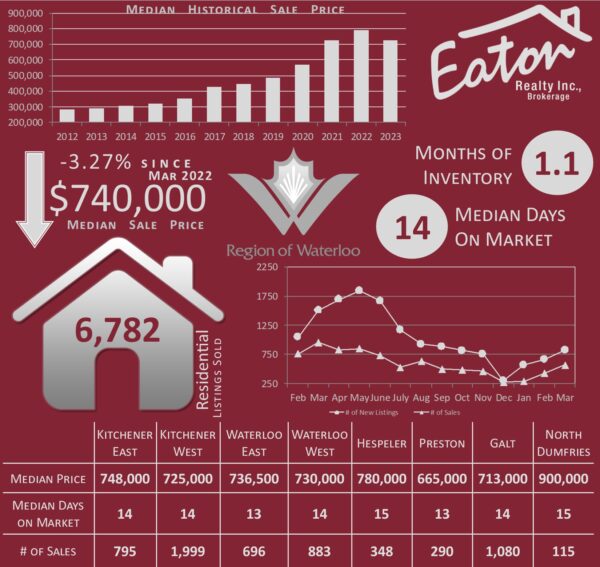
As with new home construction, the number of sales in the resale market has also dropped considerably. This slowdown has helped housing supply increase, with 4.5 weeks of inventory in the region (a 50% increase over this time last year) and while we are in line with months immediately preceding March of 2020, we are still well below the pre-pandemic 10 year average of 2.7 months. This slight increase in inventory has not been enough to significantly reign in home prices.
The absorption rate is a metric closely watched by professionals. It is used to determine how many homes are selling in a market at a particular time. An absorption rate over 20% typically signals a seller’s market in which demand is outpacing supply. While currently at 95% the absorption rate has been trending down aggressively over the past several months, down 23.7% so far this year.
One more index used to spot trends is the Aggregate Composite MLS Home Price Index (HPI), which is now 15% below its peak level in February 2022, according to CREA. Locally, the median sales price over the past 12 months has decreased 5.11% from March of 2022 to $835,000 for detached homes and down 3.2% to $605,000 for attached homes.
Statistics compiled from information available on the ITSO Database as of March 31, 2023. The Median Historical Sale Price in the graphic represents year-to-date value. All other values represent a 12 month rolling.
