Canadian housing starts jumped 41% month-over-month, far surpassing economists’ expectations and marking the largest increase in 10 years, according to the Canada Mortgage and Housing Corporation (CMHC).
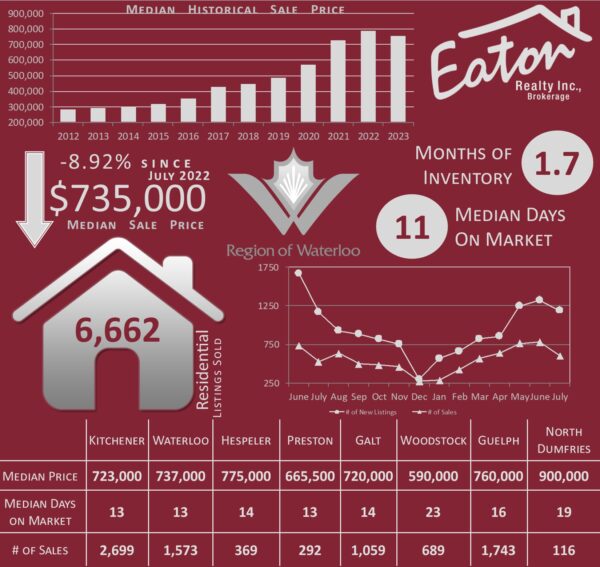
The number of home sales nationally continues to improve, rising 1.5% month-over-month as of last measure, according to the Canadian Real Estate Association (CREA), with sales up 4.7% compared to the same period last year. Locally, July saw an increase in the number of monthly sales of 10.4% over July of 2022. Market activity has picked up in recent months as homebuyers took advantage of the Bank of Canada’s temporary pause on interest rate hikes earlier this year, leading home sales to increase ahead of the Bank’s latest 0.25% rate hike in July.
The number of New Listings in July did not keep pace with the number of sales, increasing only slightly from July of 2022, up 1.37%, 1,188 new properties came on to the market during the month. This reverses the trend of increasing inventory we have experienced since the beginning of this year, as inventory levels fell in July for the first time in 2023. We currently have just over 7 weeks of inventory on the market and have an absorbtion rate of 59.25%, meaning we are still in a market that decidedly favours the Seller.
Low inventory levels are putting upward pressure on the median sale price, with the 12 month rolling average increasing slightly to $735,000. Sellers are obtaining these sales in a decidedly shorter number of days from the early days of 2023. The median number of days a property is currently spending on the market is 11, and as many frustrated Buyers know, many of these days are spent holding offers, with a large number of properties continuing to sell in multiple offers.
If a move has been on your mind, please reach out to us for a conversation. There are lots of factors to consider to get the timing correct these days, interest rate changes alone can make a significant difference in the overall cost of your home during the course of ownership.
Statistics compiled from information available on the ITSO Database as of June 30, 2023. The Median Historical Sale Price in the graphic represents year-to-date value. All other values represent a 12 month rolling.

