The Bank of Canada announced it’s keeping its interest rates unchanged at 5%. This decision aligns with its strategy of quantitative tightening. The global economy saw a slowdown in growth in the last quarter, though the US maintained strong GDP growth driven by consumption and exports. In Canada, the economy grew more than anticipated in the fourth quarter, mainly due to a significant increase in exports.
However, there are signs of sluggishness in domestic demand and employment growth. Inflation in Canada eased to 2.9% in January, primarily due to moderating goods prices, while shelter costs remain high. The Bank remains vigilant about inflation risks and aims to see sustained easing in core inflation before adjusting its policies.
Recent data released by The Canadian Real Estate Association (CREA), indicates that the housing market may be warming up right along with the weather. National home sales climbed 3.7% month-over-month, building on the 7.9% sales increase we saw in January.
Market Analysis
Although that is positive, it is important to know that while national policies and economic forces may affect the whole county, real estate is still, very much, a local marketplace and understanding local market trends is paramount for homeowners seeking to make well-informed decisions about their properties.
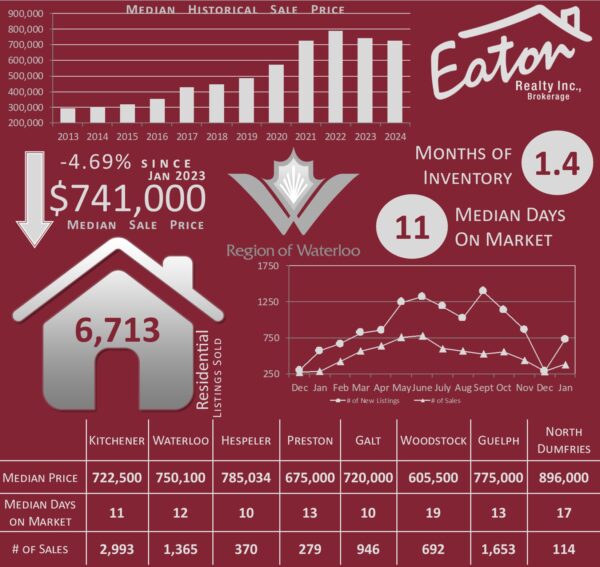
Locally the Region of Waterloo saw 485 homes sell on our MLS system in February, while this is an impressive 27% gain from January and 14% more than sold in February 2023, it is still slower than a typical February where over the last 10 years we have averaged about 600 sales in the month.
Despite somewhat depressed sales activity, the continuing low levels of inventory have kept prices stable with no change to the 12 month rolling median sale price so far this year.
Below we will examine current market dynamics and compare them to recent trends. From price stability to shifts in sales volume and inventory levels, these trends offer valuable insights into the state of the real estate market and the opportunities it presents.
Price Stability: Over the past year, the real estate market has witnessed a remarkable stability in median prices, signaling a market that has found its footing after a period of volatility. The 12 month rolling median sales price has remained relatively unchanged since last August. In that time it has not varied by more than 0.2%, remaining steady last month at 741,000.
Sales Volume: While the market continues to experience fluctuations in sales volume influenced by seasonal variations, there has been a notable uptick in activity compared to the previous month. February saw a 27% increase in the number of sales, with 485 properties changing hands. Though as noted above this was still down from a typical February, only 2 of the last 10 years saw less sales in the month.
Inventory: The number of new listings was similarly below average for the month of February, which maintained the listings to sales relationship at a relatively consistent pace, increasing inventory slightly to 6.5 weeks, just ahead of where levels were heading into the spring market last year.
Days on Market (DOM): Median and average DOM show little movement over time. Properties are taking a bit longer to sell firm compared to previous periods. The increase in conditional sales has influenced this trend, with some buyers successfully having conditional offers accepted. So while a property may not technically be sold, it is not really available either, only 15 of the 75 properties currently under conditional contracts have escape clauses, and while conditional, the DOM count continues. So keep that in mind when comparing to recent years, we saw lower DOM numbers when properties were almost always selling without a conditional period.
Pricing Dynamics: Pricing strategies continue to evolve. February saw a return to higher list to sale price ratios, with 50% of properties selling at or above their listed price. However, short-term trends reveal that both the median and average list price declined month-over-month. Long-term, the 12 month median list price remained steady over the period so we will have to see how this trend develops in the coming months.
Segment Analysis: Both detached and attached properties exhibit similar trends in median prices, DOM, average prices, and sales volume. This synchronized performance suggests similar market conditions across property types.
Recent Market Activity:The recent signs of upticks in sales activity and new property listings may indicate some stabilization or recovery in the market. Whether these trends will persist depends on various factors, including buyer sentiment, mortgage rate changes and changes in the overall economy.
Recommendations for Homeowners:
Pricing Strategy: Given the stability in median prices and consistent pricing dynamics, homeowners are advised to set competitive yet realistic listing prices. Check out our article on Pricing Psychology.
Market Awareness: Stay informed about market trends and fluctuations to make informed decisions regarding timing and pricing when listing your property.
Property Preparation: Ensure your property is well-maintained and presented attractively to appeal to potential buyers, especially in a competitive market environment, is key to a successful sale.
Flexibility: Understand that market conditions can change rapidly, so be prepared to adjust strategies and expectations accordingly.