The number of sales in March saw a two decade low with less than 600 property sales reported in the month. It’s not all bad news though, prices are up after several months of remaining relatively flat.
Canadian home sales edged down 3.1% month-over-month, according to the Canadian Real Estate Association (CREA), locally however, March saw 22.9% more sales than February did in the region.
Last month was far from a typical March however, with 20 less sales than March of 2023, which itself had less sales than we have seen in that month in over two decades.
Market Analysis
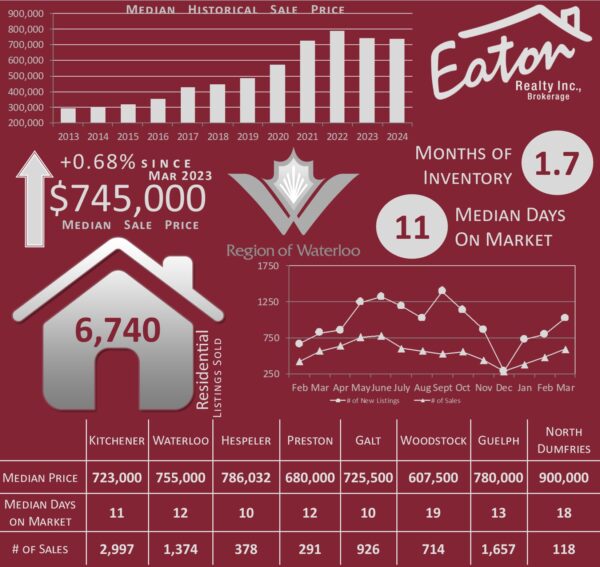
Pricing: Over the past year, the real estate market has been stable, showing little change month to month. In March however, the rolling 12-month median price increased 0.54% from the previous month to $745,000.
Sales Volume: March, typically offers the first hints of the spring market as sales begin to pick up. This year however the 596 sales represented a decline of 3.25% from March of last year. But this is not a new trend, the number of sales began a steep decline in 2022 appearing to bottom early last year. Since then the 12 month rolling number of sales has remained relatively flat.
Inventory: The number of new listings increased in March to 1,025, an 18.9% increase over March of last year. This brings the sentiment that ‘things are picking up’ but with so many factors in flux that influence the housing market it is impossible to predict how the second quarter will play out.
Days on Market (DOM): Median and average DOM continue to show little movement over time. With the Median DOM remaining at 11 days and the average increasing by one day from last year at this time to 19 days.
Pricing Dynamics: March saw a continuing of the trend from February with return to higher list to sale price ratios, with more than 50% of properties selling at or above their listed price.
Segment Analysis: Both detached and attached properties exhibit similar trends in median prices, DOM, average prices, and sales volume. This synchronized performance suggests similar market conditions across property types.
Recent Market Activity: The recent signs of upticks in sales activity and new property listings may indicate some stabilization or recovery in the market. Whether these trends will persist depends on various factors, including buyer sentiment, mortgage rate changes and changes in the overall economy.
Recommendations for Homeowners:
Pricing Strategy: Given the stability in median prices and consistent pricing dynamics, homeowners are advised to set competitive yet realistic listing prices. Check out our article on Pricing Psychology.
Market Awareness: Stay informed about market trends and fluctuations to make informed decisions regarding timing and pricing when listing your property.
Property Preparation: Ensure your property is well-maintained and presented attractively to appeal to potential buyers, especially in a competitive market environment, is key to a successful sale.
Flexibility: Understand that market conditions can change rapidly, so be prepared to adjust strategies and expectations accordingly.